Have you ever looked at a statistics problem and wondered what IQR means? You are not alone. The abbreviation may look complicated at first, but the idea behind it is surprisingly simple.
IQR meaning is Interquartile Range. It is a statistical measure that shows how spread out the middle 50% of a data set is. In simple terms, IQR helps you understand where the central part of your data lies without being heavily affected by extremely high or low values.
For example, imagine a class where most students scored between 60 and 85, but one student scored 5 and another scored 100. The interquartile range focuses on the middle portion of the scores rather than allowing those unusual values to dominate the picture.
That makes IQR especially useful when working with data that contains outliers. 📊
What Does IQR Mean?
IQR stands for Interquartile Range. It is the difference between the third quartile and the first quartile of a data set.
In basic statistical terms, the first quartile is called Q1, while the third quartile is called Q3. The IQR measures the distance between these two values.
The basic formula is:
IQR = Q3 − Q1
Here:
- Q1 represents the lower quartile, or the 25th percentile.
- Q3 represents the upper quartile, or the 75th percentile.
- IQR represents the spread of the middle 50% of observations.
So, when someone asks for the IQR meaning in statistics, the simplest answer is: it measures the range of the middle half of a data set.
IQR Meaning in Simple English

In simple English, IQR tells you how spread out the middle part of a group of numbers is.
Think of a line of people standing from shortest to tallest. Instead of looking at everyone, you focus on the people around the center. The IQR tells you how far apart the middle 50% are.
A small IQR means the middle values are relatively close together.
A large IQR means the middle values are more spread out.
This makes IQR useful when you want a quick picture of the typical spread in a data set. 📈
Why Is IQR Important?
The IQR is important because it provides a measure of statistical dispersion. Dispersion describes how much values differ from one another.
Two data sets can have the same average but very different levels of spread. Looking only at the mean may hide that difference.
IQR gives you another way to understand the data.
- It focuses on the middle 50% of values.
- It is less affected by extreme values than the range.
- It helps identify potential outliers.
- It is commonly used with the median.
- It works particularly well for skewed data.
- It is used to construct box-and-whisker plots.
For this reason, IQR is one of the most useful concepts in introductory statistics.
What Are Quartiles?
To understand IQR meaning, you first need to understand quartiles.
Quartiles divide an ordered data set into four sections. Each section contains approximately 25% of the observations.
| Quartile | Meaning | Approximate Position |
|---|---|---|
| Q1 | First quartile | 25th percentile |
| Q2 | Second quartile or median | 50th percentile |
| Q3 | Third quartile | 75th percentile |
Q2 is the median, which divides the data into two halves.
Q1 marks the middle of the lower half, while Q3 marks the middle of the upper half.
The distance between Q1 and Q3 is the interquartile range.
IQR Formula
The standard IQR formula is straightforward:
IQR = Q3 − Q1
Suppose a data set has:
- Q1 = 20
- Q3 = 45
Then:
IQR = 45 − 20 = 25
Therefore, the IQR is 25.
This means the middle 50% of the data spans 25 units.
Remember that IQR is a difference, so you subtract Q1 from Q3. You do not add the two quartiles together.
How to Calculate IQR Step by Step
Learning how to calculate IQR becomes much easier when you follow the same process each time.
Step 1: Arrange the Data
Put all numbers in ascending order, from smallest to largest.
For example:
4, 7, 9, 12, 15, 18, 21, 25, 30
Step 2: Find the Median
The median is the middle value of the ordered data.
Here, the median is 15.
Step 3: Find Q1
Take the lower half of the data, excluding the overall median when there is an odd number of observations.
Lower half:
4, 7, 9, 12
The median of this lower half is:
Q1 = 8
Step 4: Find Q3
Now look at the upper half:
18, 21, 25, 30
The median of this group is:
Q3 = 23
Step 5: Subtract Q1 From Q3
Now use the IQR formula:
IQR = Q3 − Q1
IQR = 23 − 8 = 15
So the interquartile range is 15.
IQR Example With an Even Number of Values
Let’s look at another example with an even number of observations.
Suppose the data is:
10, 12, 14, 16, 18, 20, 22, 24
There are eight values.
The lower half is:
10, 12, 14, 16
Its median is:
Q1 = 13
The upper half is:
18, 20, 22, 24
Its median is:
Q3 = 21
Therefore:
IQR = 21 − 13 = 8
The IQR is 8.
This means the central half of the observations covers a span of 8 units.
IQR vs Range
IQR and range both measure spread, but they do it differently.
The range is calculated by subtracting the smallest value from the largest value.
The IQR is calculated by subtracting Q1 from Q3.
| Measure | Formula | Focus | Effect of Outliers |
|---|---|---|---|
| Range | Maximum − Minimum | Entire data span | Strongly affected |
| IQR | Q3 − Q1 | Middle 50% | Less affected |
For example, consider these values:
10, 11, 12, 13, 14, 15, 16, 100
The value 100 is much larger than the other observations. It greatly increases the range.
However, the IQR concentrates on the middle portion of the data, so the extreme value has much less influence.
This is one reason statisticians often use IQR when outliers are present.
IQR and Outliers
One of the most important uses of the interquartile range is identifying potential outliers.
A commonly used rule defines the lower and upper boundaries as:
- Lower fence = Q1 − 1.5 × IQR
- Upper fence = Q3 + 1.5 × IQR
Values below the lower fence or above the upper fence are often flagged as potential outliers.
For example, suppose:
- Q1 = 20
- Q3 = 40
- IQR = 20
The lower fence is:
20 − 1.5 × 20 = −10
The upper fence is:
40 + 1.5 × 20 = 70
Therefore, values below −10 or above 70 would be considered potential outliers under this rule.
Importantly, an outlier identified by this method is not automatically an error. It may represent a legitimate and unusual observation.
IQR in a Box Plot
The IQR is closely connected to the box plot, also called a box-and-whisker plot.
In a typical box plot:
- The left or lower edge of the box represents Q1.
- The line inside the box represents the median.
- The right or upper edge represents Q3.
- The length of the box represents the IQR.
- Whiskers extend toward other observations according to the plotting convention.
- Potential outliers may appear separately beyond the whiskers.
So, if you see a box plot, you can often find the IQR simply by measuring the distance between the two edges of the box on the numerical scale.
📦 A wider box generally indicates a larger IQR, while a narrower box indicates a smaller IQR.
IQR vs Standard Deviation
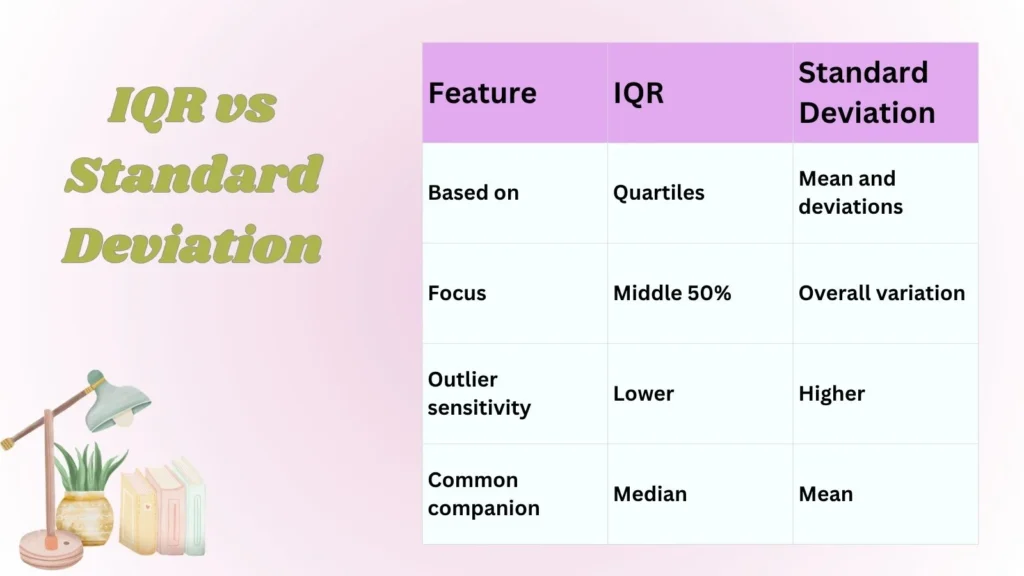
Both IQR and standard deviation describe the spread of data, but they answer slightly different questions.
Standard deviation measures how far observations generally vary from the mean.
IQR measures the distance between Q1 and Q3.
Because IQR focuses on the middle 50%, it is generally more resistant to extreme observations.
| Feature | IQR | Standard Deviation |
|---|---|---|
| Based on | Quartiles | Mean and deviations |
| Focus | Middle 50% | Overall variation |
| Outlier sensitivity | Lower | Higher |
| Common companion | Median | Mean |
Neither measure is automatically better in every situation. The appropriate choice depends on the type and distribution of the data.
What Does a Small IQR Mean?
A small IQR means the middle 50% of the observations are relatively close together.
For example, if two data sets have IQRs of 5 and 40, the first data set has a much tighter central spread.
This does not necessarily mean every value in the first data set is close together. Extreme values can still exist outside the central 50%.
Therefore, IQR should always be interpreted in context.
What Does a Large IQR Mean?
A large IQR means the middle 50% of the observations are more widely distributed.
Imagine two groups of test scores. If one group has an IQR of 8 and another has an IQR of 30, the second group’s central scores are more spread out.
A large IQR can indicate greater variability in the central part of a data set.
Again, the meaning depends on the units and context. An IQR of 20 could be small in one field and large in another.
Why IQR Works Well With the Median
The IQR and median are often used together because both are relatively resistant to extreme observations.
The median describes the center of the data.
The IQR describes the spread around that central region.
This combination is particularly useful for skewed data.
For example, income data can contain a small number of extremely high values. The mean may be pulled upward by those values, while the median can provide a more resistant measure of central tendency. The IQR can then show how widely the middle half of incomes is distributed.
IQR Meaning in Statistics
In statistics, IQR meaning refers specifically to the distance between the first and third quartiles.
It is a measure of variability or dispersion.
Statisticians may use IQR when analyzing:
- Test scores
- Household incomes
- Temperatures
- Product prices
- Waiting times
- Medical measurements
- Survey responses
- Business data
- Population measurements
- Experimental results
Because it emphasizes the central portion of the distribution, IQR is especially useful when a data set is not symmetrical or contains unusual observations.
IQR in Real-Life Examples
The concept of IQR may sound mathematical, but it has many practical applications.
Test Scores
A teacher can use IQR to understand how spread out the middle group of student scores is.
A small IQR could indicate that the central group performed within a relatively narrow score range.
House Prices
Real estate analysts can examine the IQR of house prices to understand the spread of the middle 50% of property values.
Extremely expensive properties may affect the maximum value, but they have less influence on the IQR.
Waiting Times
A company could analyze customer waiting times using IQR. If the IQR is large, the central group of customers may experience noticeably different waiting periods.
Weather Data
Researchers can use IQR to examine the spread of temperatures during a particular period.
This can provide a useful view of typical variation without letting unusually hot or cold readings dominate the measurement.
IQR Example With a Real-World Data Set
Imagine a shop records the number of customers visiting during nine different hours:
18, 20, 21, 23, 25, 27, 29, 31, 35
The median is 25.
The lower half is:
18, 20, 21, 23
Therefore:
Q1 = 20.5
The upper half is:
27, 29, 31, 35
Therefore:
Q3 = 30
Now calculate:
IQR = 30 − 20.5 = 9.5
So, the IQR is 9.5 customers.
The interpretation is that the middle 50% of the recorded customer counts span 9.5 units.
Common Uses of IQR
The interquartile range appears in many areas where data needs to be summarized clearly.
- Education: Comparing the spread of student scores.
- Business: Examining sales, revenue, or customer data.
- Economics: Studying income and price distributions.
- Science: Summarizing experimental measurements.
- Medicine: Describing distributions of measured variables.
- Research: Reporting variability in samples.
- Data analysis: Detecting potential unusual observations.
- Visualization: Building and interpreting box plots.
IQR vs Median vs Mean
These statistical terms are related, but they do different jobs.
| Term | What It Measures | Main Purpose |
|---|---|---|
| Mean | Average | Measures arithmetic center |
| Median | Middle value | Measures central position |
| IQR | Q3 − Q1 | Measures central spread |
| Range | Maximum − Minimum | Measures total spread |
A useful way to remember the difference is:
Mean and median tell you where the data is centered, while IQR tells you how spread out the middle of the data is.
Does IQR Have Units?
Yes. The IQR normally has the same units as the original data.
For example, if you are measuring height in centimeters, the IQR is measured in centimeters.
If you are measuring income in dollars, the IQR is measured in dollars.
If you are measuring time in minutes, the IQR is measured in minutes.
This makes IQR easy to interpret because its units remain connected to the original measurement.
Can IQR Be Zero?
Yes, an IQR can be zero.
This happens when Q1 and Q3 are equal.
For example, consider:
5, 5, 5, 5, 5, 5, 5
Here, Q1 and Q3 are both 5.
Therefore:
IQR = 5 − 5 = 0
An IQR of zero means the central 50% has no spread under the chosen quartile calculation.
Can IQR Be Negative?
No. Under the standard definition, the IQR cannot be negative.
Since Q3 is at or above Q1 in an ordered data set, subtracting Q1 from Q3 produces a value that is zero or positive.
If you calculate a negative IQR, check whether you accidentally subtracted Q3 from Q1 or calculated one of the quartiles incorrectly.
Different Ways of Calculating Quartiles
One important detail is that different statistical software, calculators, textbooks, and conventions can use slightly different methods for calculating quartiles, particularly when the sample size does not divide neatly.
For simple classroom problems, follow the method specified by your teacher or textbook.
For computer-based analysis, the software may use an interpolation method rather than simply taking the median of each half.
This means two methods can occasionally produce slightly different Q1, Q3, and IQR values for the same small data set.
The key is to use one consistent method and clearly understand which convention you are following.
Common Mistakes When Calculating IQR

1. Forgetting to Sort the Data
Quartiles depend on the order of the observations. Always arrange the data from smallest to largest before finding Q1 and Q3.
2. Using the Maximum and Minimum
IQR is not the same as range. Do not calculate maximum minus minimum when the question asks for IQR.
3. Adding Q1 and Q3
The IQR is found by subtraction, not addition.
IQR = Q3 − Q1
4. Confusing Q2 With Q3
Q2 is the median. Q3 is the 75th percentile. They are not interchangeable.
5. Treating Every Outlier as an Error
A potential outlier may be a valid observation. The IQR rule identifies unusual values; it does not automatically prove that they are mistakes.
6. Ignoring the Quartile Method
Different conventions can produce slightly different quartile values. Use the method required for your assignment or analysis.
FAQs:
What does IQR stand for?
IQR stands for Interquartile Range. It measures the spread of the middle 50% of a data set and is calculated as Q3 minus Q1.
What is the simple meaning of IQR?
In simple terms, IQR tells you how spread out the middle half of your data is.
What is the formula for IQR?
The standard formula is IQR = Q3 − Q1, where Q1 is the first quartile and Q3 is the third quartile.
What does a high IQR mean?
A high IQR means the middle 50% of observations are more spread out. A low IQR means those central observations are closer together.
Is IQR the same as range?
No. Range uses the maximum and minimum values, while IQR uses Q1 and Q3. IQR is therefore less affected by extreme observations.
Final Thoughts:
The abbreviation stands for Interquartile Range, and its formula is Q3 minus Q1. It is especially useful when data contains outliers or when you want a resistant measure of spread.
Whether you are studying statistics, analyzing business data, interpreting a box plot, or completing a school assignment, knowing how to calculate and interpret IQR can make data much easier to understand. 📊

I am Henry James and i am a passionate writer and language enthusiast behind PunPalace, a platform dedicated to exploring meanings, word origins, and simple explanations. My aims to make learning vocabulary easy, engaging, and accessible for everyone.